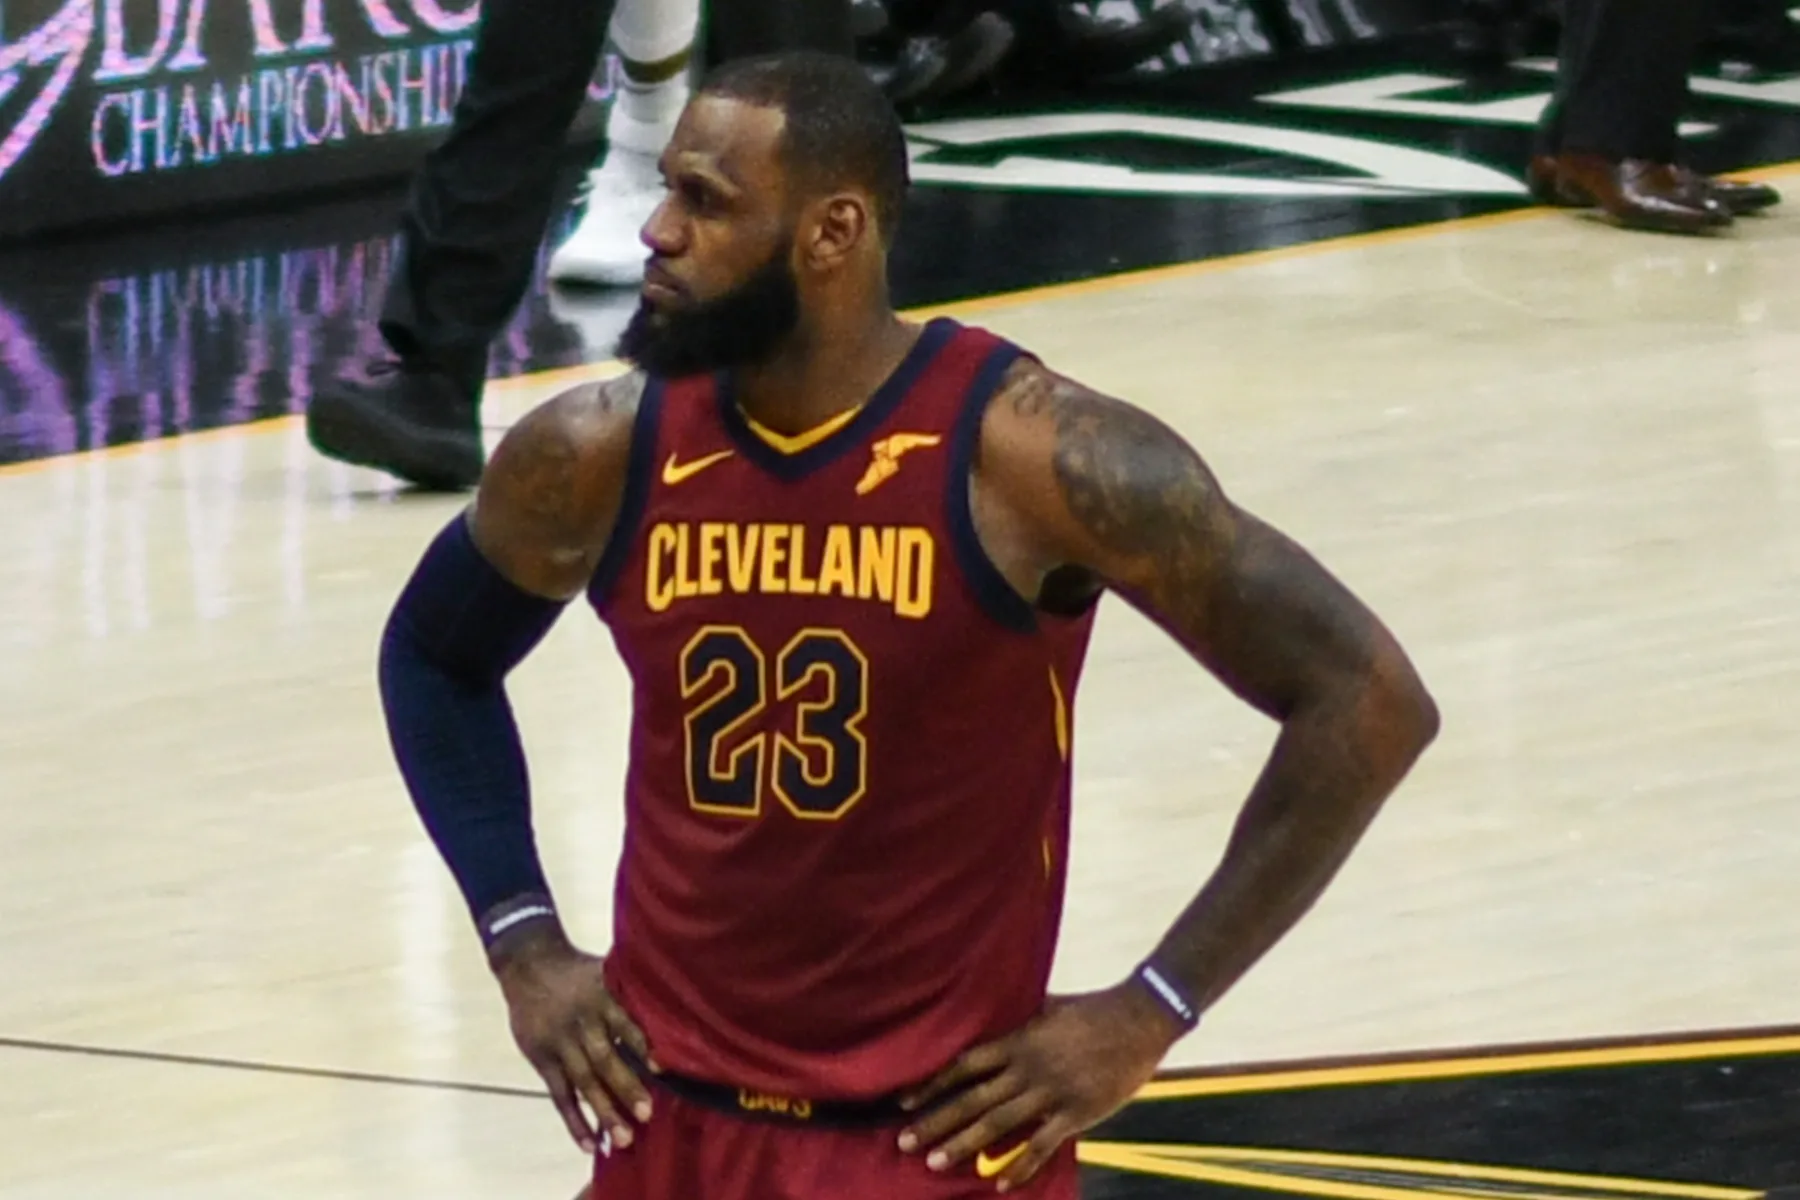
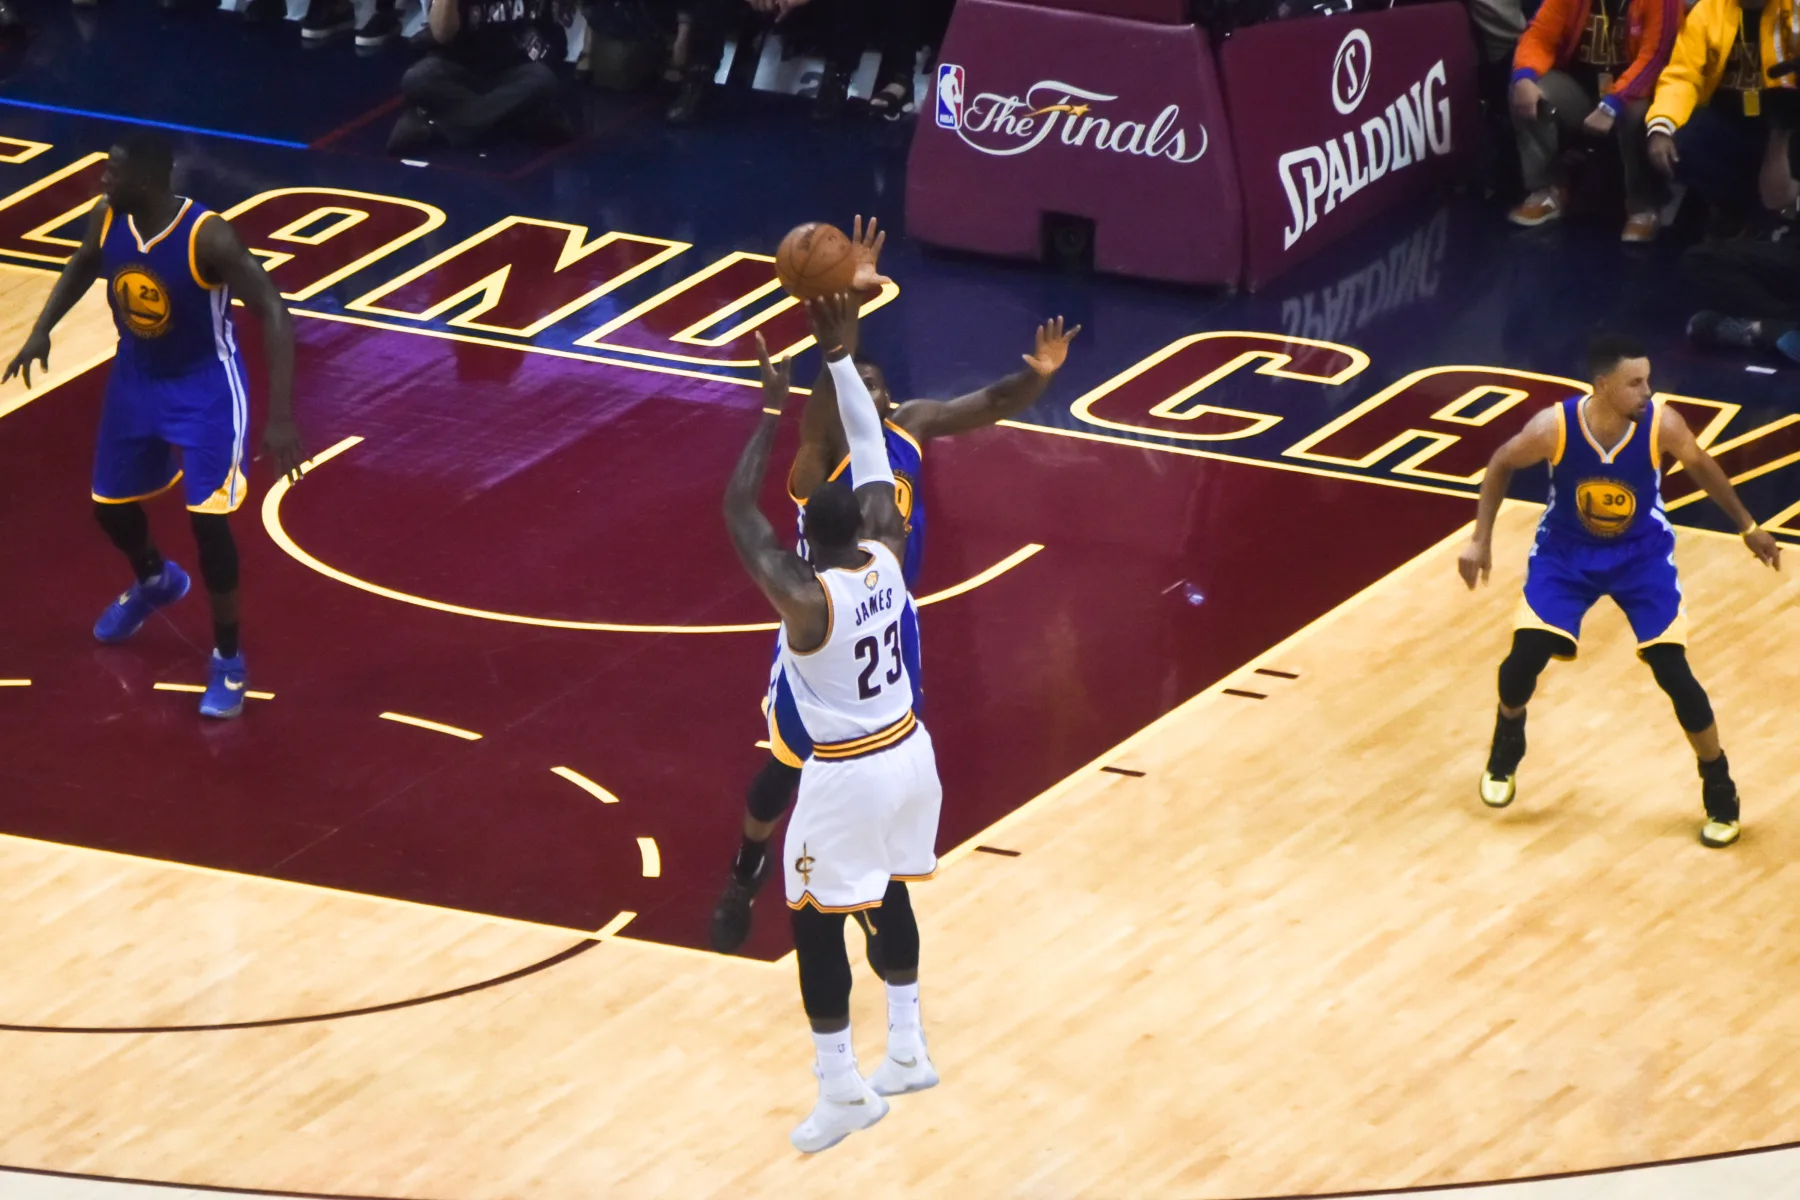
LeBron · Cleveland, 2018Photo: Erik Drost · February 27, 2018 · source · CC BY 2.0 · cropped
2323
Basketball · Career-value analysis · August 2026
Jordan vs. LeBron, without the cherry-picking
LeBron has the best career and is the best all-around player. Jordan has the strongest completed-title-run peak and is the best scorer. LeBron is my GOAT.
SM
Shanu Mathew
30 min read · Last checked October 6, 2026 · Statistics through 2025–26
Title-run peakMichael Jordan
Scoring supremacy, elite title runs and championship conversion
Career + breadthLeBron James
Total value, all-around mastery, adaptability and longevity
The premise
Most Michael Jordan versus LeBron James arguments are constructed backwards: pick the player first, then choose the evidence. Jordan supporters point to 6–0 in the Finals, scoring titles and competitive mythology. LeBron supporters point to career totals, all-around production and longevity. All of those facts matter. None settles the debate by itself.
My answer: LeBron has produced the best overall career and is the best all-around basketball player I have ever seen. Jordan has the strongest completed-title-run peak, and he is the best scorer I have ever seen. LeBron is my 1A; Jordan is my 1B. I choose LeBron because he could solve more kinds of basketball problems at an elite level.
Jordan's resume is absurd. His scoring pressure remains difficult to comprehend, and the available impact evidence supports the view that he raised both floors and ceilings. Giving LeBron the final edge requires precision about what the numbers establish and where judgment enters.
I compare the complete cases across rate, total value, role, playoff performance and team context. No single metric or series answers everything.
Unless otherwise noted, statistics are through the 2025–26 season. Historical studies cover only the periods specified beside them.
The shape of the argument
Height is rate. Width is career.
Box plus/minus per 100 possessionsCareer playoff minutes
Michael Jordan
+11.1 box plus/minus across 7,474 minutes
LeBron James
+9.8 box plus/minus across 12,446 minutes
A schematic of two figures from the comparison below. Each shape’s height is that player’s career box plus/minus. Its width is his career minutes. Shape area has no statistical interpretation and does not represent VORP, Win Shares or total value. No season-by-season curve is implied. Statistics through 2025–26.
01Rate value
What a player produced per minute or possession.
02Total value
Elite production multiplied across games, seasons and playoff rounds.
03Team context
Opponent, roster and franchise evidence. Informative, rarely causal.
Cumulative impact, minutes, playoff volume, longevity and portability
Jordan has the stronger completed-title-run peak case. LeBron has the stronger cumulative case. The peak result still changes with the test: LeBron owns a credible single-season statistical claim, while Jordan's best championship run is stronger. One combined score would hide those weighting choices.
Role breadth runs through every window. Jordan was a complete player; scoring created his largest advantage. LeBron could become the scorer, passer, rebounder, transition engine, matchup hunter or defensive helper a roster needed. That adaptability drives my GOAT case.
Player Efficiency Rating (PER), Box Plus/Minus (BPM), Value Over Replacement Player (VORP) and Win Shares reuse many of the same box-score inputs. I treat them as one corroborating family. Career averages compare Jordan's 15 seasons with LeBron's 23, which answers a career question without creating an equal-window peak test. I start with the playoffs, establish the regular-season base, isolate peak and then add the team context.
02
Start where the stakes are highest: the playoffs
I default every switchable chart to the playoffs because that is where the debate usually ends up. The definitions stay fixed.
Evidence02
Core comparison
Playoffs
Career playoff statistics through 2026. Championships are team outcomes; career-average rates are not pure peak measures.
Best default for the GOAT question
The complete ledger, without choosing a peak or career weighting first.
LeBron Jordan
Both player bars use the same labeled scale within each row. Compare players within a row, never across different measures.
Games
LeBron
Games0 → 320
LeBron302
Jordan179
Minutes
LeBron
Minutes0 → 14,000
LeBron12,446
Jordan7,474
PTS / REB / AST
LeBron · rebounds + assists
PTS0 → 36
LeBron28.2
Jordan33.4
REB0 → 9.2
LeBron8.9
Jordan6.4
AST0 → 7.4
LeBron7.2
Jordan5.7
Field-goal attempts per game
Jordan · +4.7 per game
Field-goal attempts per game0 → 28
LeBron20.4
Jordan25.1
Steals / blocks
Split
Steals0 → 2.4
LeBron1.7
Jordan2.1
blocks0 → 1.2
LeBron1.0
Jordan0.9
True shooting
LeBron raw
True shooting0 → 100%
LeBron58.3%
Jordan56.8%
Usage rate
Jordan ended more possessions
Usage rate0 → 100%
LeBron31.6%
Jordan35.6%
Assist percentage
LeBron
Assist percentage0 → 100%
LeBron35.1%
Jordan28.2%
Assist-to-turnover ratio
LeBron
Assist-to-turnover ratio0 → 2.2
LeBron2.00
Jordan1.87
Turnover percentage
Jordan lower; role-sensitive
Turnover percentageLower is better0 → 100%
LeBron12.9%
Jordan9.4%
PER
Jordan
PER0 → 32
LeBron27.6
Jordan28.6
Win Shares per 48
Jordan
Win Shares per 480 → .28
LeBron.232
Jordan.255
Offensive BPM
Jordan
Offensive BPM0 → 9
LeBron+7.3
Jordan+8.8
Defensive BPM
Essentially even; noisy estimate
Defensive BPM0 → 2.8
LeBron+2.5
Jordan+2.3
Total BPM
Jordan
Total BPM0 → 12
LeBron+9.8
Jordan+11.1
VORP
LeBron
VORP0 → 40
LeBron37.1
Jordan24.7
Win Shares
LeBron
Win Shares0 → 64
LeBron60.2
Jordan39.8
Record
Jordan rate; LeBron volume
Playoff wins0 → 200
LeBron188
Jordan119
Win rate0 → 100%
LeBron62.3%
Jordan66.5%
Championships / Finals MVPs
Jordan
Championships0 → 6.2
LeBron4
Jordan6
Finals MVPs0 → 6.2
LeBron4
Jordan6
Bar length encodes the printed value on that row’s axis. It does not encode an overall GOAT score; the interpretation label states the basketball judgment.
Jordan leads this selected family of composite box-score rate measures and remains the greatest playoff scorer by points per game. He also attempted 4.7 more field goals per playoff game.
The bundled points, rebounds and assists row goes to LeBron: Jordan leads scoring, while LeBron leads both rebounding and assists.
LeBron also leads raw shooting efficiency while carrying a larger creation role.
Jordan committed fewer turnovers per scoring possession; LeBron generated more assists per turnover. Turnover percentage does not credit ordinary passes or assists, so it cannot by itself measure who “protected possessions” better.
LeBron leads this comparison in cumulative playoff value; Jordan leads in the selected composite rate metrics and championship conversion.
The shot burden makes Jordan's scoring case more concrete. He attempted 25.1 field goals per playoff game to LeBron's 20.4, a 23% difference, while LeBron held a modest 58.3% to 56.8% true-shooting edge. Jordan produced more scoring from far more attempts per game at broadly comparable efficiency. Usage rate extends that picture by also counting free-throw trips and turnovers that ended possessions.
Career averages compress the timing. Plotting each postseason against games actually accumulated shows when the rate and volume cases diverged.
Evidence03
Rate sustained across volume
Every postseason run, plotted across actual playoff games
Each dot is one full postseason. The horizontal axis accumulates games, so longer runs occupy more space. True shooting is recalculated from the summed series totals. Career averages still cover different lengths and career phases.
Every postseason run, plotted across actual playoff games
Player
Postseason
Season
Games
Cumulative games
PPG
RPG
APG
TS
LeBron James
1
2005-06
13
13
30.8
8.1
5.8
55.7%
LeBron James
2
2006-07
20
33
25.1
8.1
8.0
51.6%
LeBron James
3
2007-08
13
46
28.2
7.8
7.6
52.5%
LeBron James
4
2008-09
14
60
35.3
9.1
7.3
61.8%
LeBron James
5
2009-10
11
71
29.1
9.3
7.6
60.7%
LeBron James
6
2010-11
21
92
23.7
8.4
5.9
56.3%
LeBron James
7
2011-12
23
115
30.3
9.7
5.6
57.6%
LeBron James
8
2012-13
23
138
25.9
8.4
6.6
58.5%
LeBron James
9
2013-14
20
158
27.4
7.1
4.8
66.8%
LeBron James
10
2014-15
20
178
30.1
11.3
8.5
48.7%
LeBron James
11
2015-16
21
199
26.3
9.5
7.6
58.5%
LeBron James
12
2016-17
18
217
32.8
9.1
7.8
64.9%
LeBron James
13
2017-18
22
239
34.0
9.1
9.0
61.9%
LeBron James
14
2019-20
21
260
27.6
10.8
8.8
64.7%
LeBron James
15
2020-21
6
266
23.3
7.2
8.0
56.4%
LeBron James
16
2022-23
16
282
24.5
9.9
6.5
58.4%
LeBron James
17
2023-24
5
287
27.8
6.8
8.8
63.7%
LeBron James
18
2024-25
5
292
25.4
9.0
5.6
60.1%
LeBron James
19
2025-26
10
302
23.2
6.7
7.3
55.0%
Michael Jordan
1
1984-85
4
4
29.3
5.8
8.5
56.5%
Michael Jordan
2
1985-86
3
7
43.7
6.3
5.7
58.4%
Michael Jordan
3
1986-87
3
10
35.7
7.0
6.0
52.9%
Michael Jordan
4
1987-88
10
20
36.3
7.1
4.7
59.8%
Michael Jordan
5
1988-89
17
37
34.8
7.0
7.6
60.2%
Michael Jordan
6
1989-90
16
53
36.7
7.2
6.8
59.2%
Michael Jordan
7
1990-91
17
70
31.1
6.4
8.4
60.0%
Michael Jordan
8
1991-92
22
92
34.5
6.2
5.8
57.1%
Michael Jordan
9
1992-93
19
111
35.1
6.7
6.0
55.3%
Michael Jordan
10
1994-95
10
121
31.5
6.5
4.5
55.7%
Michael Jordan
11
1995-96
18
139
30.7
4.9
4.1
56.4%
Michael Jordan
12
1996-97
19
158
31.1
7.9
4.8
52.4%
Michael Jordan
13
1997-98
21
179
32.4
5.1
3.5
54.5%
Jordan never averaged below 29.3 points in any of his 13 postseasons. That is rate dominance in its clearest form. LeBron's line extends another 123 games and six playoff runs while retaining elite scoring and much higher rebounding and creation rates.
The chart is the debate in miniature. Jordan packed more scoring into every game. LeBron advanced farther across more seasons while carrying more kinds of responsibility. The objective is to play at the highest level possible, advance as far as possible and repeat it. LeBron reached 302 playoff games without turning the added runway into low-value minutes.
The leaderboards show where that accumulation landed historically. Each category prints the top five through 2026, followed by a clearly separated LeBron or Jordan row when either sits outside that range.
Evidence04
The accumulated postseason
All-time playoff leaderboards, category by category
Top five on each Basketball Reference NBA/ABA career playoff leaderboard through 2026, plus LeBron or Jordan whenever either sits outside the top five. Rebounds begin in 1950–51, minutes in 1951–52, and steals and blocks in 1973–74.
Seven career leaderboardsTop five · featured exceptions
Every rank is attached to a named player. A separate row keeps LeBron and Jordan visible whenever either falls outside the top five.
PointsComplete
#1LeBron James8,521
#2Michael Jordan5,987
#3Kareem Abdul-Jabbar5,762
#4Kobe Bryant5,640
#5Shaquille O'Neal5,250
ReboundsSince 1950–51
#1Bill Russell4,104
#2Wilt Chamberlain3,913
#3Tim Duncan2,859
#4LeBron James2,695
#5Shaquille O'Neal2,508
Featured outside top five
#46Michael Jordan1,152
AssistsComplete
#1Magic Johnson2,346
#2LeBron James2,168
#3John Stockton1,839
#4Jason Kidd1,263
#5Chris Paul1,233
Featured outside top five
#13Michael Jordan1,022
GamesComplete
#1LeBron James302
#2Derek Fisher259
#3Tim Duncan251
#4Robert Horry244
#5Kareem Abdul-Jabbar237
Featured outside top five
#21Michael Jordan179
MinutesSince 1951–52
#1LeBron James12,446
#2Tim Duncan9,370
#3Kareem Abdul-Jabbar8,851
#4Kobe Bryant8,641
#5Scottie Pippen8,105
Featured outside top five
#12Michael Jordan7,474
StealsSince 1973–74
#1LeBron James506
#2Scottie Pippen395
#3Michael Jordan376
#4Magic Johnson358
#5John Stockton338
BlocksSince 1973–74
#1Tim Duncan568
#2Kareem Abdul-Jabbar476
#3Hakeem Olajuwon472
#4Shaquille O'Neal459
#5David Robinson312
Featured outside top five
#10LeBron James287
#37Michael Jordan158
NBA/ABA career playoff ranks through 2026. Rebounds begin in 1950–51, minutes in 1951–52, and steals and blocks in 1973–74.
All-time playoff leaderboards, category by category
Measure
Rank
Player
Career total
Row type
Coverage
Games
1
LeBron James
302
Top five
Complete
Games
2
Derek Fisher
259
Top five
Complete
Games
3
Tim Duncan
251
Top five
Complete
Games
4
Robert Horry
244
Top five
Complete
Games
5
Kareem Abdul-Jabbar
237
Top five
Complete
Games
21
Michael Jordan
179
Featured · outside top five
Complete
Minutes
1
LeBron James
12,446
Top five
Since 1951–52
Minutes
2
Tim Duncan
9,370
Top five
Since 1951–52
Minutes
3
Kareem Abdul-Jabbar
8,851
Top five
Since 1951–52
Minutes
4
Kobe Bryant
8,641
Top five
Since 1951–52
Minutes
5
Scottie Pippen
8,105
Top five
Since 1951–52
Minutes
12
Michael Jordan
7,474
Featured · outside top five
Since 1951–52
Points
1
LeBron James
8,521
Top five
Complete
Points
2
Michael Jordan
5,987
Top five
Complete
Points
3
Kareem Abdul-Jabbar
5,762
Top five
Complete
Points
4
Kobe Bryant
5,640
Top five
Complete
Points
5
Shaquille O'Neal
5,250
Top five
Complete
Rebounds
1
Bill Russell
4,104
Top five
Since 1950–51
Rebounds
2
Wilt Chamberlain
3,913
Top five
Since 1950–51
Rebounds
3
Tim Duncan
2,859
Top five
Since 1950–51
Rebounds
4
LeBron James
2,695
Top five
Since 1950–51
Rebounds
5
Shaquille O'Neal
2,508
Top five
Since 1950–51
Rebounds
46
Michael Jordan
1,152
Featured · outside top five
Since 1950–51
Assists
1
Magic Johnson
2,346
Top five
Complete
Assists
2
LeBron James
2,168
Top five
Complete
Assists
3
John Stockton
1,839
Top five
Complete
Assists
4
Jason Kidd
1,263
Top five
Complete
Assists
5
Chris Paul
1,233
Top five
Complete
Assists
13
Michael Jordan
1,022
Featured · outside top five
Complete
Steals
1
LeBron James
506
Top five
Since 1973–74
Steals
2
Scottie Pippen
395
Top five
Since 1973–74
Steals
3
Michael Jordan
376
Top five
Since 1973–74
Steals
4
Magic Johnson
358
Top five
Since 1973–74
Steals
5
John Stockton
338
Top five
Since 1973–74
Blocks
1
Tim Duncan
568
Top five
Since 1973–74
Blocks
2
Kareem Abdul-Jabbar
476
Top five
Since 1973–74
Blocks
3
Hakeem Olajuwon
472
Top five
Since 1973–74
Blocks
4
Shaquille O'Neal
459
Top five
Since 1973–74
Blocks
5
David Robinson
312
Top five
Since 1973–74
Blocks
10
LeBron James
287
Featured · outside top five
Since 1973–74
Blocks
37
Michael Jordan
158
Featured · outside top five
Since 1973–74
LeBron owns the playoff records for games, minutes, points and steals. He is second in assists, fourth in rebounds and 10th in blocks, placing him inside the top ten in all five major box-score totals. Jordan remains second in points and third in steals; his other ranks are printed rather than implied. This is the historical footprint created by the run-by-run chart: how often each player reached the stage and how much elite production he delivered once there.
LeBron has 39.6% more combined regular-season and playoff VORP, 196.5 to 140.8, and 32.8% more combined Win Shares, 337.0 to 253.8. The sums cover separate regular-season and playoff games. VORP derives from BPM and minutes, while Win Shares draws from many of the same box inputs. Together they provide two related views of a real volume advantage.
Jordan's playoff BPM is about 13% higher and his playoff Win Shares per 48 about 10% higher. The playoffs establish the central split under the highest stakes. The regular season asks whether it survives across a much larger sample.
03
The regular-season foundation
The regular season shows the same split across a much larger sample.
Evidence05
Core comparison
Regular season
Career statistics through 2025–26. Raw true shooting is not adjusted for era, opponent or shot mix. Jordan's career includes his two Washington seasons.
Best default for the GOAT question
The complete ledger, without choosing a peak or career weighting first.
LeBron Jordan
Both player bars use the same labeled scale within each row. Compare players within a row, never across different measures.
Games
LeBron
Games0 → 1,800
LeBron1,622
Jordan1,072
Minutes
LeBron
Minutes0 → 64,000
LeBron61,030
Jordan41,011
PTS / REB / AST
LeBron · rebounds + assists
PTS0 → 32
LeBron26.8
Jordan30.1
REB0 → 7.8
LeBron7.5
Jordan6.2
AST0 → 7.6
LeBron7.4
Jordan5.3
Field-goal attempts per game
Jordan · +3.5 per game
Field-goal attempts per game0 → 26
LeBron19.4
Jordan22.9
Steals / blocks
Jordan on rate
Steals0 → 2.6
LeBron1.5
Jordan2.3
blocks0 → 0.82
LeBron0.7
Jordan0.8
True shooting
LeBron raw
True shooting0 → 100%
LeBron59.0%
Jordan56.9%
Usage rate
Jordan ended more possessions
Usage rate0 → 100%
LeBron31.3%
Jordan33.3%
Assist percentage
LeBron
Assist percentage0 → 100%
LeBron36.4%
Jordan24.9%
Assist-to-turnover ratio
LeBron
Assist-to-turnover ratio0 → 2.4
LeBron2.13
Jordan1.93
Turnover percentage
Jordan lower; role-sensitive
Turnover percentageLower is better0 → 100%
LeBron13.3%
Jordan9.3%
PER
Jordan
PER0 → 30
LeBron26.7
Jordan27.9
Win Shares per 48
Jordan
Win Shares per 480 → .28
LeBron.218
Jordan.250
Offensive BPM
Jordan
Offensive BPM0 → 7.4
LeBron+6.7
Jordan+7.2
Defensive BPM
Jordan by noisy box estimate
Defensive BPM0 → 2.2
LeBron+1.6
Jordan+2.0
Total BPM
Jordan
Total BPM0 → 9.4
LeBron+8.4
Jordan+9.2
VORP
LeBron
VORP0 → 180
LeBron159.4
Jordan116.1
Win Shares
LeBron
Win Shares0 → 300
LeBron276.8
Jordan214.0
Bar length encodes the printed value on that row’s axis. It does not encode an overall GOAT score; the interpretation label states the basketball judgment.
LeBron leads the raw career true-shooting comparison, 59.0% to 56.9%. That comparison includes Jordan's two Wizards seasons. His Bulls-only mark was 58.0%. Pace, spacing, defensive rules and shot mix still complicate any claim about the harder scoring environment; raw true shooting does not adjust for those differences.
Jordan also attempted 22.9 field goals per regular-season game to LeBron's 19.4, an 18% difference. Usage percentage broadens shot volume into the share of team possessions that ended with the player's field-goal attempt, free-throw trip or turnover while he was on the floor. The metric excludes possessions completed by an assist, so it captures only part of total offensive involvement. Jordan ended a larger share; LeBron organized more possessions that teammates finished.
Jordan's best evidence is concentrated scoring and composite rate dominance. LeBron's is all-around creation plus an enormous volume of elite play.
04
What changes when we actually measure peak
Calling career-average rate statistics “peak” skips the most important question. Different defensible peak tests produce different winners.
Evidence06
Definition-sensitive
What changes when we actually measure peak
BPM and Win Shares reuse box-score inputs. I treat them as one evidence family. The table shows how the answer changes with the chosen window and title constraint.
LeBron's 2009 season prevents a clean claim that Jordan owns every statistical definition of peak. LeBron posted the higher regular-season BPM and the highest single-postseason BPM either player produced, albeit across a 14-game run that ended in the conference finals.
Jordan's case strengthens when the test demands both apex performance and championship completion. His 1991 run combined 31.1 points, 6.4 rebounds and 8.4 assists per game with .600 true shooting, +14.6 BPM and a title. His best title-run BPM sits above LeBron's +11.0 in 2016.
Jordan has the strongest completed-title-run peak. LeBron has a credible single-season statistical peak case. My final peak judgment depends on how much weight I place on championship completion. Jordan deserves to have the rest of his case heard from that strongest position.
05
Jordan's strongest case goes beyond 6–0
23
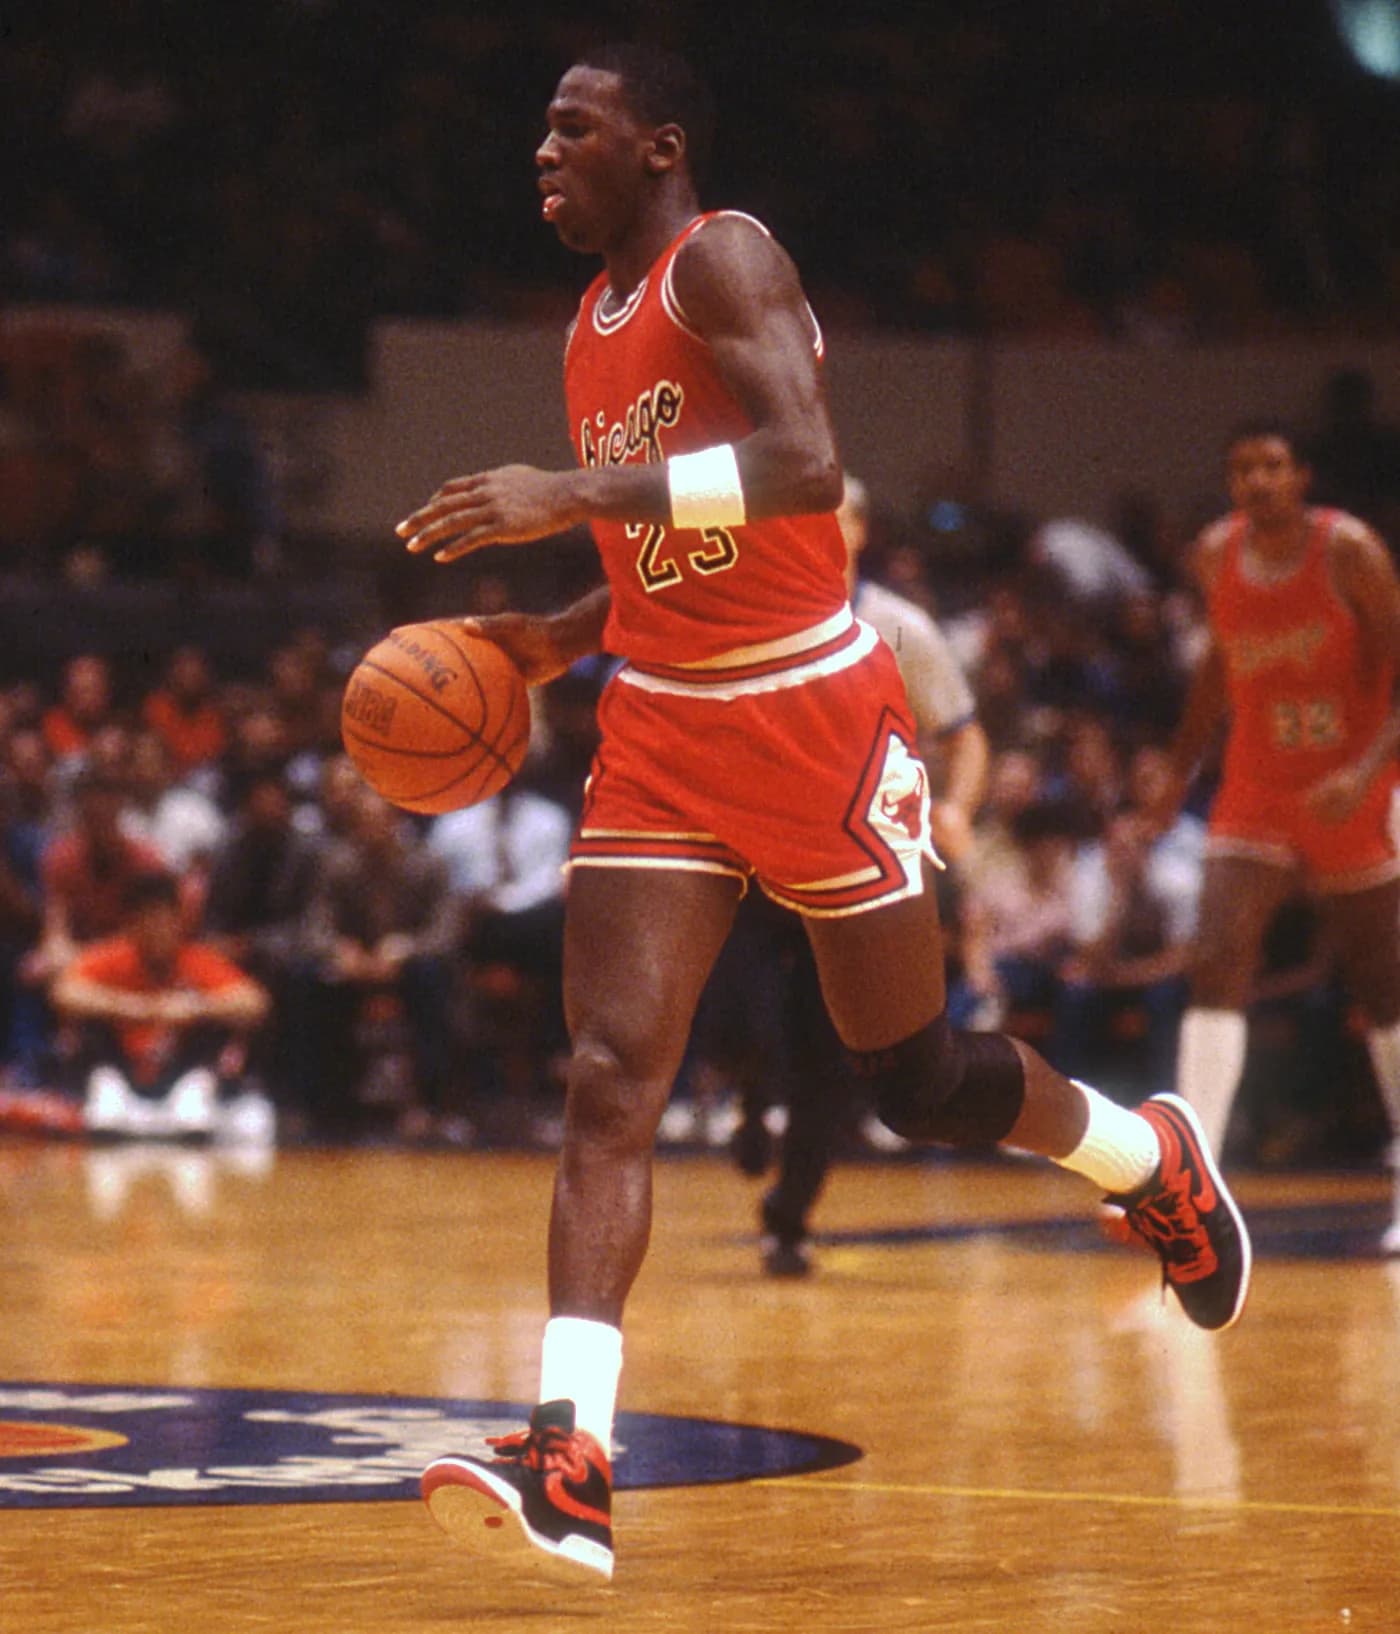
The scorer arrivesThe command was visible before the titles were.Jordan in a preseason exhibition against New York at Madison Square GardenPhoto: Carmine Galasso / The Record · October 18, 1984 · source · Public domain in the U.S. · Editorial crop; otherwise unaltered.
Jordan leads all four selected composite rate measures in both samples:
Evidence07
One family of evidence
Jordan’s rate-metric advantage
Jordan LeBron
PER
Playoffs
030
Jordan 28.6 vs. LeBron 27.6
Regular season
030
Jordan 27.9 vs. LeBron 26.7
WS/48
Playoffs
0.30
Jordan .255 vs. LeBron .232
Regular season
0.30
Jordan .250 vs. LeBron .218
BPM
Playoffs
012
Jordan +11.1 vs. LeBron +9.8
Regular season
010
Jordan +9.2 vs. LeBron +8.4
OBPM
Playoffs
010
Jordan +8.8 vs. LeBron +7.3
Regular season
08
Jordan +7.2 vs. LeBron +6.7
PER, WS/48, BPM and OBPM reuse overlapping box-score inputs. Treat them as one family of evidence, not four independent votes.
These are one correlated family of evidence, but the pattern is real. Jordan ranks first in NBA history in career playoff BPM, playoff Win Shares per 48 and playoff points per game. His career playoff usage was 35.6%, four percentage points above LeBron's, while his turnover percentage was 9.4%.
That combination is exceptional. Public career data cannot tell us that every Jordan shot was harder or displaced a worse option. It does show exceptional scoring volume, strong shooting efficiency and a low box-score turnover rate from the player who ended the largest share of Chicago's possessions.
His defensive resume matters too: Defensive Player of the Year, nine All-Defensive First Teams and three steals titles. Jordan has 2,514 officially credited regular-season steals, 97 more than LeBron in 550 fewer games. Historical box scores have measurement problems. An unpublished 2026 reconstruction paper reported discrepancies in older steal records; in one audited 1988 game, Jordan was credited with five steals and only two were identified on film. One game cannot establish inflation across an entire season. That caveat limits precision around the exact steal gap while leaving the broader awards and impact case intact.
One incomplete film reconstruction points the same way. In the games researchers reconstructed from 1984–85 through 1995–96, a lineup model that adjusts for teammates and opponents estimates Jordan was worth about nine extra points per 100 possessions. That is an elite result. The dataset covers only 17% of possible games, comes from an unpublished paper and relies on one primary film coder, so I use it as supporting evidence rather than a definitive cross-era ranking.
Jordan also lifted unfinished teams before the dynasty. Chicago won 27 games before drafting him and 38 in his rookie season. His 1–9 record across his first three playoff appearances included two exits against Bird's Celtics, including the 67–15 champion in 1986. By 1989 and 1990, the Bulls had reached consecutive conference finals.
Those transitions provide descriptive context without causal controls. Jordan raised the floor of unfinished teams, then brought his greatest scoring years into an elite, coherent structure.
If I am choosing one fully healthy player for a single championship run, I lean Jordan. His claim is built on concentration: more scoring pressure, stronger career rate metrics and a sharper completed-title apex. That is the strongest short-horizon case. LeBron's answer covers much more time and many more basketball jobs.
06
LeBron's case is breadth across time
23
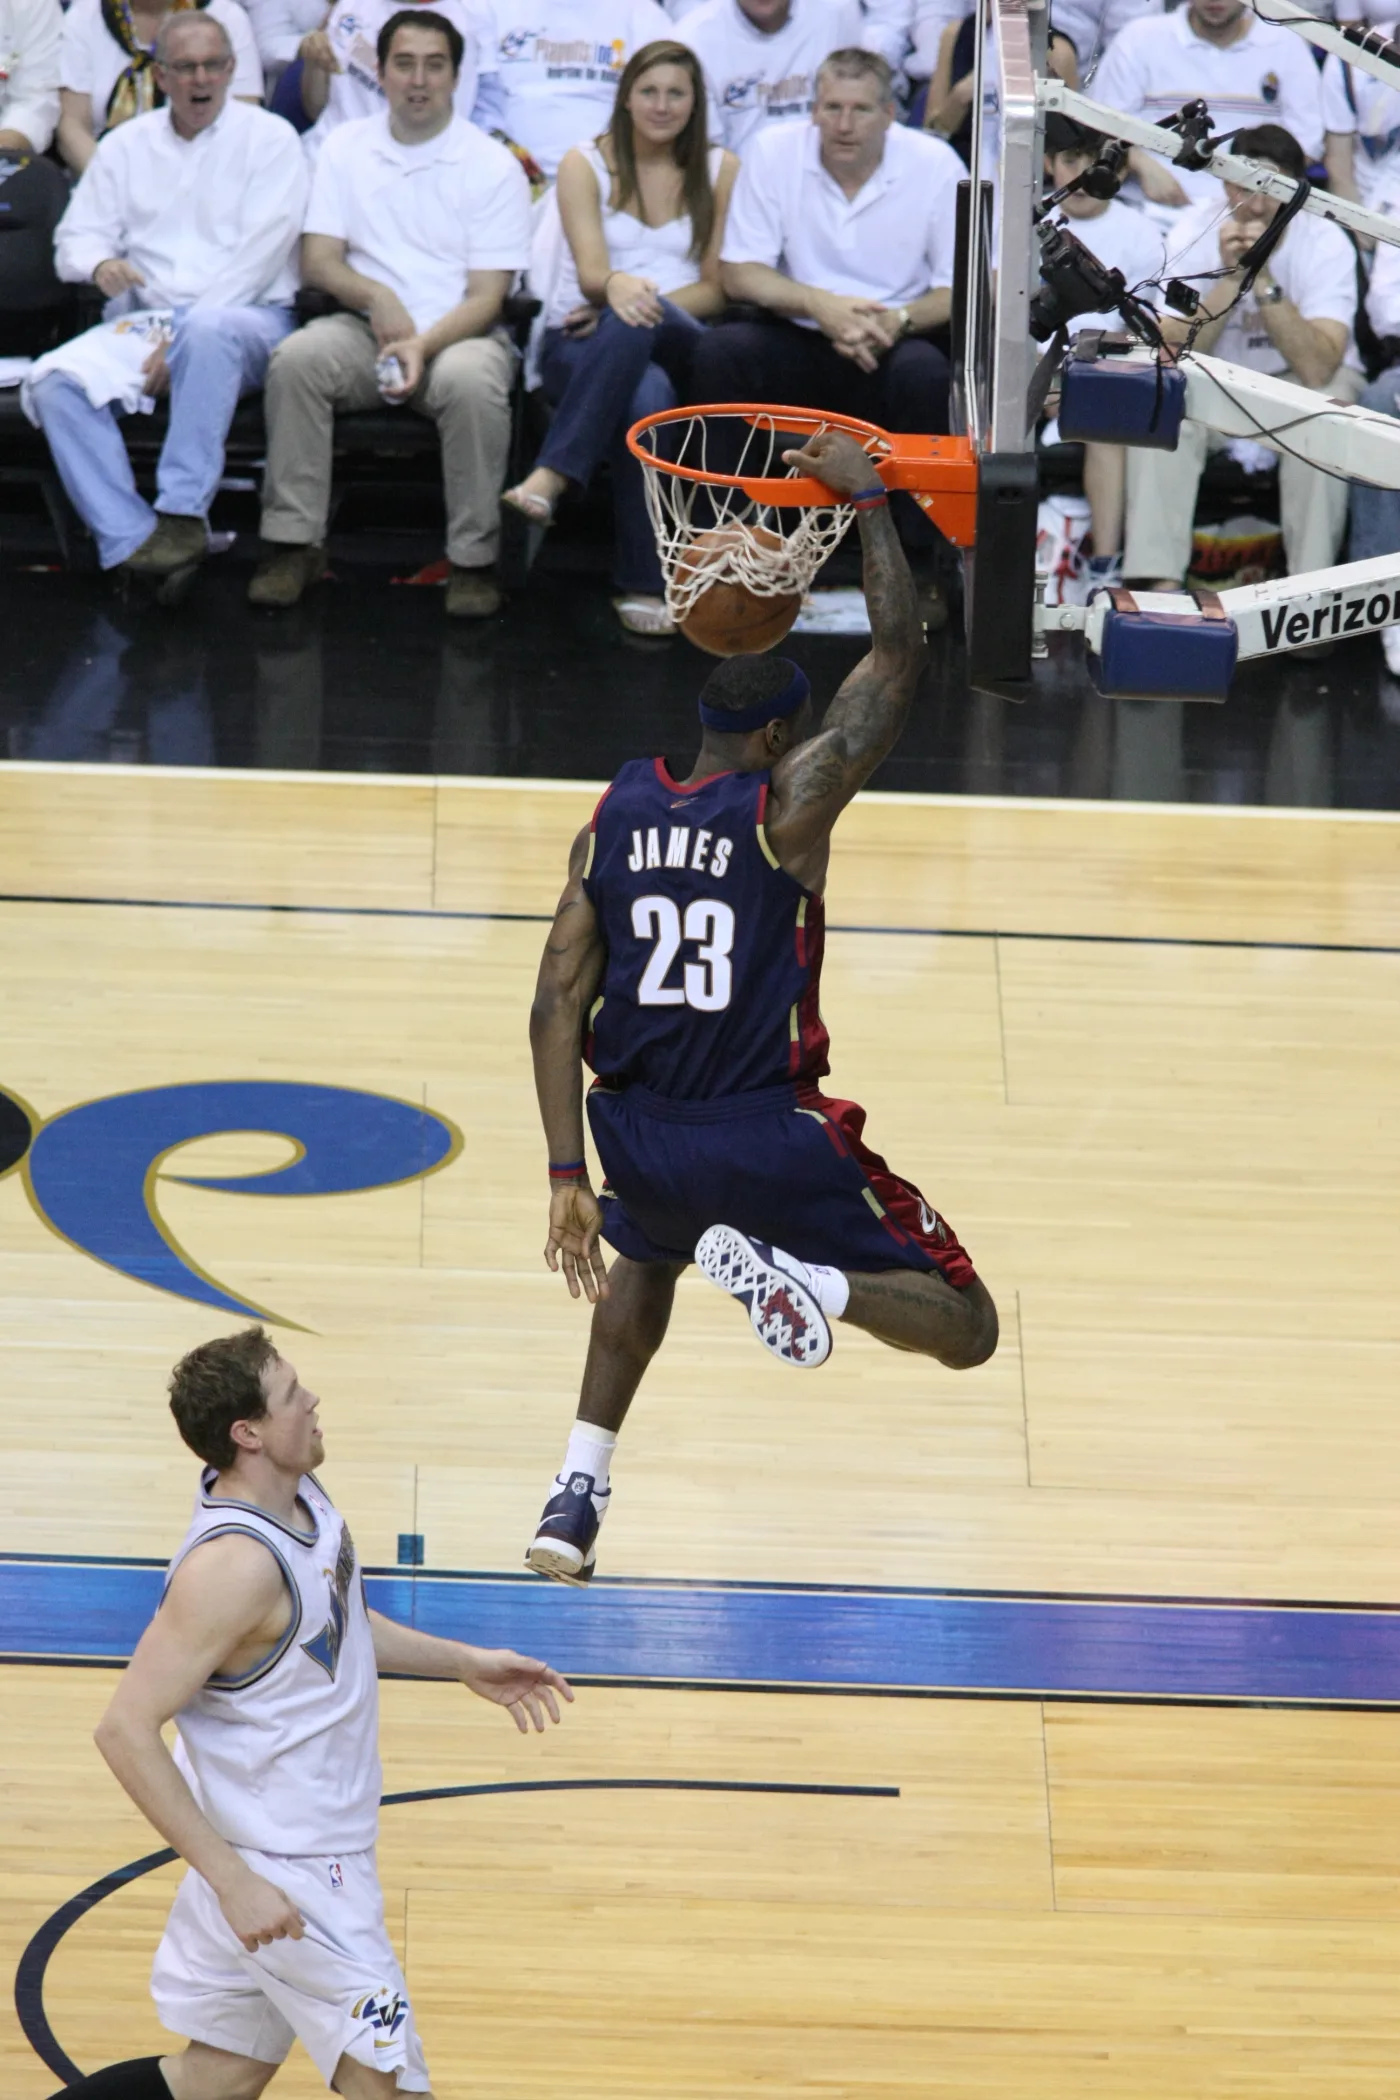
Force, before reinventionThe first Cleveland version bent the court with raw pressure.LeBron rises for a dunk against WashingtonPhoto: Keith Allison · April 24, 2008 · source · CC BY-SA 2.0 · Editorial crop; otherwise unaltered.
Longevity by itself is an incomplete description of LeBron's case. The real claim is sustained excellence: elite rate multiplied across more high-level seasons and playoff games than anyone else has produced.
I've watched LeBron enter a slower, more crowded league still dominated by Shaquille O'Neal, Kobe Bryant, Kevin Garnett and Tim Duncan; play through the spread pick-and-roll transition; and remain elite in the Stephen Curry and Kevin Durant era of high-volume threes, pace, spacing and switching. Across that arc he became an overwhelming downhill scorer, a pace-and-space organizer, a post mismatch, a spread pick-and-roll quarterback and, later, a selective matchup hunter who could screen and roll. The league changed; his body changed; the job changed. He repeatedly rebuilt the center of his game.
Start with scoring rate. LeBron averaged at least 20 points in all 23 seasons and at least 25 in a record 20 consecutive seasons. Jordan reached 20 in all 15 of his seasons and 25 in 12. Durant's 17 seasons at 25 or more across 18 seasons is extraordinary. LeBron still added three more at that level, then remained above 20 through age 41.
Evidence08
Scoring rate × time
Elite scoring did not fade into empty longevity
NBA-only regular seasons through 2025–26 for the current top ten career scorers. Career season counts only seasons in which the player appeared. The 20- and 25-point thresholds use unrounded Basketball Reference season averages.
The season-by-season line shows how long each scorer sustained his rate. The companion chart changes the denominator from seasons to minutes and plots accumulated points against opportunity for the same cohort. It defaults to the playoffs, where earning more games and maintaining production are both part of the test. The toggle then expands to all career minutes or isolates the regular season. A steeper path from the origin means a higher scoring rate.
Evidence09
Minutes × points
Career scoring, plotted as rate and accumulated volume
The cohort is the current top ten NBA regular-season career scorers through 2025–26. The chart defaults to playoffs and can switch to regular season or both combined. Farther right means more minutes; farther up means more points. The 18, 24 and 30 points-per-36 guides are fixed scoring rates, not trend lines.
Point key
LeBron James
Kareem Abdul-Jabbar
Karl Malone
Kobe Bryant
Kevin Durant
Michael Jordan
Dirk Nowitzki
Wilt Chamberlain
James Harden
Shaquille O'Neal
LeBron · Playoffs8,521 points
12,446 minutes · 24.6 PTS/36
Jordan · Playoffs5,987 points
7,474 minutes · 28.8 PTS/36
LeBron produced 2,534 more points across 4,972 more minutes. Jordan scored 28.8 points per 36 minutes to LeBron's 24.6.
Career scoring, plotted as rate and accumulated volume
Player
Regular minutes
Regular points
Playoff minutes
Playoff points
All minutes
All points
LeBron James
61,030
43,440
12,446
8,521
73,476
51,961
Kareem Abdul-Jabbar
57,446
38,387
8,851
5,762
66,297
44,149
Karl Malone
54,852
36,928
7,907
4,761
62,759
41,689
Kobe Bryant
48,637
33,643
8,641
5,640
57,278
39,283
Kevin Durant
44,077
32,597
6,934
5,008
51,011
37,605
Michael Jordan
41,011
32,292
7,474
5,987
48,485
38,279
Dirk Nowitzki
51,368
31,560
5,895
3,663
57,263
35,223
Wilt Chamberlain
47,859
31,419
7,559
3,607
55,418
35,026
James Harden
42,450
29,339
6,940
4,240
49,390
33,579
Shaquille O'Neal
41,918
28,596
8,098
5,250
50,016
33,846
At 41, LeBron finished his 23rd season at the same 20.9 points per game he averaged as a rookie. Between those endpoints, he averaged at least 25 points for 20 consecutive seasons, followed by two more above 20. His career average remains 26.8 points, 7.5 rebounds and 7.4 assists across 1,622 games. The total grew because the rate stayed exceptional.
Scoring is only one side of the accumulation. Through 2025–26, LeBron has 43,440 regular-season points, 12,095 rebounds, 12,016 assists, 2,417 steals and 1,185 blocks. He ranks first in regular-season points, fourth in regular-season assists and second in playoff assists. He remains the only player with at least 10,000 points, rebounds and assists.
The leading assist players are overwhelmingly pass-first guards. The leading scorers are overwhelmingly finishers. LeBron sits at the extreme end of both distributions while also clearing 12,000 rebounds. His GOAT case begins with that combination.
The season curve establishes sustained scoring. The three reciprocal leaderboards test how much more LeBron accumulated at the same time. Their 30 top-ten places belong to 26 players. LeBron is the only player in NBA history who ranks in the top ten in both regular-season points and assists. At 23rd in rebounds, he is also the only player inside the top 25 in all three categories. No one appears in all three top tens.
Evidence10
Career-volume atlas
The top ten, viewed from all three directions
NBA-only regular-season totals through 2025–26. Each reciprocal rank refers to the full leaderboard, not this ten-player view. A 250+ is a verified lower bound meaning outside the top 250, not an exact rank. No ties occur in these three top tens. Totals reward longevity and role.
NBA regular season · all time
Points top 10
Who scored most, plus how far their passing and rebounding reached.
The first number is rank on the selected leaderboard. The three printed chips show each player’s rank on the full points, rebounds and assists lists; “250+” means outside the top 250. It is a verified lower bound, not an exact rank.
Career totals are role- and longevity-sensitive. Points favor high-usage finishers, assists favor initiators and rebounds favor frontcourt players. That is why the reciprocal ranks matter more than adding unlike events into a homemade total: LeBron's 1st / 23rd / 4th scoring-rebounding-passing signature crosses positional boundaries that usually separate these lists.
For a broader five-stat view, I use the published top ten in regular-season career VORP to choose the comparison set. VORP cannot measure the pre-1973–74 NBA on equal terms, and I do not use it as the verdict. It gives me a transparent cumulative-value selection rule before I inspect the five displayed categories.
Evidence11
Cumulative value · production shape
Five-stat profiles of the career VORP leaders
The cohort and row order follow the published NBA regular-season career VORP top ten. Kareem’s points, rebounds and assists cover all 20 seasons. His VORP, steals and blocks begin in 1973–74 because the NBA did not officially record steals or blocks during his first four seasons; Wilt and Russell lack comparable VORP coverage. Every bar is independently scaled to the largest value in its own column; compare lengths only within a column.
≠
No homemade “all-around total.”A point, rebound, assist, steal and block are not interchangeable units. VORP selects the cohort; the raw columns show how each player produced that career value.
Scroll to compare every category →
NBA regular-season career VORP top ten with career points, rebounds, assists, steals and blocks through 2025–26
VORP leader
VORPScale max 159.39
PTSScale max 43.4k
REBScale max 17.4k
ASTScale max 15.8k
STLScale max 3.3k
BLKScale max 3.2k
#1LeBron James
159.39
43,440
12,095
12,016
2,417
1,185
#2Michael Jordan
116.05
32,292
6,672
5,633
2,514
893
#3John Stockton
106.53
19,711
4,051
15,806
3,265
315
#4Karl Malone
98.96
36,928
14,968
5,248
2,085
1,145
#5Chris Paul
98.79
23,058
6,006
12,552
2,728
222
#6Kevin Garnett
96.86
26,071
14,662
5,445
1,859
2,037
#7Kevin Durant
92.22
32,597
8,254
5,280
1,236
1,344
#8Tim Duncan
91.09
26,496
15,091
4,225
1,025
3,020
#9James Harden
87.85
29,339
6,809
8,873
1,794
683
#10Kareem Abdul-Jabbar
85.72*
38,387
17,440
5,660
1,160*
3,189*
How to compare: every number is printed; bar lengths share a scale only within the same column.
* Kareem: PTS, REB and AST cover all 20 seasons. Only VORP, STL and BLK begin in 1973–74 and omit his first four NBA seasons because those defensive statistics were not yet officially recorded.
The column leaders are spread across specialists, which makes LeBron's cross-category rank more striking. Within this cohort he has the most points, the third-most assists, the fifth-most rebounds, the fourth-most steals and the fifth-most blocks. No one else combines scoring and creation at his scale while also exceeding 12,000 rebounds.
Career totals show the breadth accumulated. Full-postseason team leads test how often those jobs became simultaneous responsibility during one run. Across each full postseason run, using team totals, LeBron led or tied for the team lead in scoring 16 of 19 times, rebounds 11 times and assists 18 times. Jordan led in scoring all 13 times, rebounds none and assists nine times. These totals are availability-weighted, so games played matter alongside per-game role.
Evidence12
Role and burden
Breadth of playoff responsibility
Led or tied team in scoring
LeBron16 of 19
Jordan13 of 13
Led or tied team in rebounds
LeBron11 of 19
Jordan0 of 13
Led or tied team in assists
LeBron18 of 19
Jordan9 of 13
Each mark is one playoff run: filled where he led his team in that category, open where he did not.
Full-postseason team totals for each completed run; ties count. Totals capture availability as well as role, and category leadership does not imply equal value across categories.
LeBron's scoring count includes one tie with Anthony Davis in 2024, so it is 15 outright leads plus one tie. A rebound, assist and point carry different values. The full-run totals show role breadth: LeBron was repeatedly his team's leading scorer, primary organizer and a leading rebounder during the same postseason.
That breadth survived two distinct Cleveland tenures, a star-heavy Miami roster and several Lakers constructions. LeBron is the first player to win Finals MVP with three franchises. Each environment demanded a different version of him.
Evidence13
Contextual timeline
Franchise transitions around LeBron
Contextual, not causal. Rosters, injuries, coaches, incentives and replacement players changed at the same time.
0 wins4182 wins
Cleveland · first arrival
Before17–65 before his rookie yearAfter35–47 in his rookie year
Cleveland · first departure
Before61–21 in his final seasonAfter19–63 the next season
Miami · arrival
Before47–35 before his arrivalAfter58–24 and a Finals appearance in his first season
Miami · departure
Before54–28 in his final seasonAfter37–45 the next season
Cleveland · return
Before33–49 before his returnAfter53–29 and a Finals appearance
Cleveland · second departure
Before50–32 in his final seasonAfter19–63 the next season
Every bar uses the same 0–82 win axis. The paired seasons are descriptive context, not an estimate of LeBron’s individual causal effect.
Those transitions show how the franchise changed around each move, but they are not clean experiments: rosters, coaches, injuries, incentives and replacement players changed simultaneously. The within-tenure records offer a second descriptive view.
Evidence14
Games played versus missed
How LeBron’s teams performed with and without him
Regular season only. Descriptive, not causal: the missed-game samples are smaller, schedules differ and other players were sometimes unavailable too.
The missed-game samples are 26, 18, 27 and 156 games, versus 548, 294, 301 and 479 games played. Schedules and co-injuries differ, so these are descriptive gaps without a causal interpretation. In every stint, the team posted a materially better regular-season record when LeBron played. The comparison cannot isolate roster quality, schedule, co-injuries or replacement-player quality.
The record splits establish availability context. On-off narrows the view to the minutes each player was actually on or off the court. LeBron's raw regular-season on-court plus/minus is +7,508 across 61,030 minutes. That total is real, but it is not a fair Jordan comparison. It multiplies margin by playing time, and official play-by-play coverage begins after most of Jordan's prime. The normalized playoff view below uses net points per 100 possessions and makes the source differences explicit.
LeBron's row reports player-minute-weighted means of annual playoff team net ratings. On-court, off-court and swing values are rounded independently, so displayed subtraction can differ from the displayed swing by 0.1. Jordan's row uses the reconstructed playoff career summary published by Basketball History Database, checked on October 6, 2026. The aggregation methods differ, so the rows provide context rather than a like-for-like impact ranking.
Evidence15
Impact while playing
How the scoreboard moved with each player on and off the court
Playoffs only. LeBron uses player-minute-weighted annual team net ratings from Basketball Reference. Jordan uses Basketball History Database's reconstructed playoff career summary, checked October 6, 2026. Aggregation methods differ. These are unadjusted descriptive estimates, not a like-for-like ranking. Independent rounding can change displayed subtraction by 0.1. The regular-season comparison is omitted pending a complete current input export.
Player on courtPlayer off courtCommon axis: −12 to +12 points per 100
Career postseason
Playoffs
LeBron302 games · complete
+5.2-4.0
On-off+9.3
Jordan179 games · reconstructed · complete
+7.7-10.4
On-off+18.1
Positive net rating means the team outscored opponents. On, off and swing are independently rounded, so displayed subtraction can differ by 0.1. The comparison is descriptive and does not adjust for lineup quality, opponent strength or when the player rested.
How the scoreboard moved with each player on and off the court
Player
Scope
On-court net / 100
Off-court net / 100
On-off swing / 100
Coverage
LeBron James
Playoffs
+5.2
−4.0
+9.3
302 games · complete
Michael Jordan
Playoffs
+7.7
−10.4
+18.1
179 games · reconstructed · complete
Both players' teams were materially better with them on the court in the covered samples. Jordan's reconstructed swings are larger. They also depend more heavily on estimated historical possessions, and neither player's unadjusted on-off controls for teammates, opponents or bench quality. I treat the comparison as strong evidence of impact, not a precise cross-era ranking.
Across these views, LeBron repeatedly supplied four functions: primary scorer, primary creator, transition engine and lineup organizer. That reduced the number of unsolved basketball problems around him. Portability asks how much of that value travels when the role and roster change.
07
Portability, usage and what “fit” means
The split has now appeared in rate, totals and team context. Jordan ended more possessions with a shot, free throw or turnover. LeBron redistributed more production through passing and rebounding. PER and BPM work from the box score, so the role distinction matters alongside Jordan's scoring advantage.
Jordan did exactly what a high-usage scorer must do: he converted exceptional volume into efficient offense. His scoring advantage cannot simply be discounted as usage inflation.
Why Jordan's scoring edge is more than a usage artifact
Shot burden: Jordan attempted 25.1 field goals per playoff game to LeBron's 20.4, and 22.9 per regular-season game to LeBron's 19.4.
Efficiency at volume: his Bulls-only career true shooting was 58.0% while averaging 31.5 points. His full-career mark includes two lower-efficiency Wizards seasons.
Playoff translation: in a matched Bulls-only comparison, his scoring rose from 31.5 to 33.4 points per game while true shooting moved from 58.0% to 56.8%.
Possession security: his box-score turnover rate was 9.3% in the regular season and 9.4% in the playoffs despite enormous scoring responsibility.
Sustained volume: ten scoring titles and a 35.6% career playoff usage rate make the burden a defining pattern, not a short peak.
The useful conceptual decomposition is scoring value, plus creation value, minus turnover cost. Public career summaries cannot isolate those components cleanly enough for a literal equation. Jordan has the stronger scoring and scoring-possession turnover case. LeBron has the stronger creation case.
LeBron could initiate as a point guard, score as a wing, post up, screen, roll, rebound and provide help-side rim protection. At different peaks he credibly handled matchups across several positional types. As tactics changed, he moved from explosive downhill scorer, to post threat and lead distributor, to a more deliberate matchup hunter. He improved as a shooter, altered his defensive workload and did more screening as constant on-ball force became less sustainable.
“LeBron fits anywhere” can still be overstated. His offenses usually became LeBron-centric. Wade, Bosh and Love surrendered substantial offensive responsibility, and his teams prioritized shooting, defense and secondary creation around him. That was rational because LeBron was often the best available offensive system, but it was roster tailoring.
Jordan was more scalable than the ball-hog caricature suggests. He ceded initiation to Scottie Pippen in the triangle, became an elite post player and scored through cuts, pin-downs, transition and quick mid-post actions. He could create a shot without holding the ball for an entire possession. His championship evidence is concentrated within one unusually coherent Bulls ecosystem. LeBron repeatedly found a championship-level answer as franchise, roster and league changed.
Evidence16
Assessment
Portability and role assessment
JordanNeither clearlyLeBron
Who demonstrated the broader offensive role portfolio?
LeBron
Who won at a championship level across more franchise and roster contexts?
LeBron
Who carried weak offensive personnel more directly?
Reasonable LeBron edge
Who combined higher scoring volume with better box-score possession security?
Jordan
Who created more elite value without controlling the ball?
Jordan
Who projects more cleanly beside another primary creator?
Reasonable Jordan edge
View underlying data table
Portability and role assessment
Role question
Answer
Who demonstrated the broader offensive role portfolio?
LeBron
Who won at a championship level across more franchise and roster contexts?
LeBron
Who carried weak offensive personnel more directly?
Reasonable LeBron edge
Who combined higher scoring volume with better box-score possession security?
Jordan
Who created more elite value without controlling the ball?
Jordan
Who projects more cleanly beside another primary creator?
Reasonable Jordan edge
LeBron has the broader demonstrated record across roles, rosters and franchises. Jordan has the stronger offensive-scalability case. He produced more scoring at higher shot volume, posted lower box-score turnover rates and created elite value without controlling the ball. That supports a reasonable Jordan edge beside another primary creator, while LeBron's wider track record supports the adaptability edge. Jordan's championship record is concentrated in one franchise, leaving his title-level fit elsewhere untested. It is not evidence that his game would travel less. The fairest conclusion is narrower: LeBron demonstrated more kinds of portability; Jordan demonstrated a cleaner plug-and-play scoring fit. Team context is the next test.
08
Team context and competition
Counting Hall of Fame teammates by name is a poor method. It treats an aging Shaquille O'Neal or Robert Parish like the player who built the Hall of Fame resume. Teammate quality belongs to the season being evaluated: minutes, impact, awards, health and playoff performance.
The cleanest available first pass is to match honors to the exact season two players shared a roster. I count both the raw teammate-selections and the share of career seasons with at least one honored teammate. The rate controls for career length. All-NBA is the more selective default.
Evidence17
Contemporaneous help
Who actually shared seasons with current stars
A teammate counts only when he shared an NBA roster with the subject and earned All-Star or All-NBA honors in that same regular season. Percentages divide seasons with at least one honored teammate by career seasons. This measures top-end recognized talent, not depth, health, fit, coaching or continuity.
0%25%50%75%100%
LeBron James23 career seasons
30.4%
7 of 23seasons
7teammate-selections
Michael Jordan15 career seasons
40.0%
6 of 15seasons
6teammate-selections
Stephen Curry17 career seasons
35.3%
6 of 17seasons
8teammate-selections
Kevin Durant18 career seasons
55.6%
10 of 18seasons
11teammate-selections
Tim Duncan19 career seasons
52.6%
10 of 19seasons
11teammate-selections
Kobe Bryant20 career seasons
65.0%
13 of 20seasons
13teammate-selections
Shaquille O'Neal19 career seasons
68.4%
13 of 19seasons
14teammate-selections
Default: All-NBA. A teammate is counted only when he shared a roster and earned the honor in that same regular season. The rate is seasons with at least one such teammate divided by the star’s career seasons.
LeBron had far more All-Star teammate-selections than Jordan, 19 to six, and slightly more All-NBA selections, seven to six. Career length explains part of that gap. Jordan had an All-NBA teammate in 40.0% of his seasons, compared with LeBron's 30.4%. Both sit below Shaq, Kobe, Durant and Duncan on that tougher season-share measure. LeBron had real star support. Several modern greats spent a larger share of their careers beside current All-NBA teammates.
Season-level honors answer who shared the roster. A game-level postseason count asks whether that recognized help was actually on the floor for the win. The All-NBA result is especially sensitive to Pippen because he accounts for nearly all of Jordan's overlap with a current All-NBA teammate. The All-Star view is a useful second lens.
Evidence18
Playoff context
Winning without a current All-NBA or All-Star teammate
Choose the honor. A win qualifies only when no teammate selected to that season’s All-NBA or All-Star team appeared. All-NBA is the stricter recognition test; All-Star is the broader sensitivity check. Both views measure volume and availability, not complete roster quality.
Winning without a current All-NBA or All-Star teammate
Honor lens
Player
Qualifying playoff wins
Reported all-time rank
Career playoff wins
Share of career playoff wins
All-NBA
LeBron James
116
#1
188
61.7%
All-NBA
Michael Jordan
39
#30
119
32.8%
All-Star
LeBron James
66
#1
188
35.1%
All-Star
Michael Jordan
45
#5
119
37.8%
The 2026 HoopsHype reviews define a qualifying win as one in which no teammate selected to that season's honor appeared. Under the stricter All-NBA lens, LeBron's 116 ranks first and Jordan's 39 ranks 30th. The row-level ledger rebuilds both totals and the partial-availability seasons.
The All-Star control changes the shape of the comparison. LeBron still leads the raw count, 66 to 45. Jordan has the slightly higher share of career playoff wins, 37.8% to 35.1%. Pippen was not an All-Star in 1991 or 1998, so all 30 wins from those title runs qualify. Jordan also gets one 1990 win when Pippen missed Game 4 against Philadelphia. LeBron gets 16 wins from the 2016 title run because Kyrie Irving and Kevin Love were not selected that season, even though both were established stars. The result is much closer under the broader honor.
Honors still miss depth, injuries, fit, continuity and playoff form. They identify contemporaneous top-end recognition. They do not grade an entire roster.
Jordan's title infrastructure was exceptionally strong and stable. Scottie Pippen played on all six title teams and made All-NBA in five of those seasons. Horace Grant supplied two-way frontcourt value during the first three-peat; Dennis Rodman added rebounding and defense during the second; Toni Kukoč provided secondary creation; and Phil Jackson and Tex Winter supplied a coherent system.
The 1993–94 Bulls won 55 games without Jordan after winning 57 the year before, then lost in the second round. That season shows Jordan left a high-level roster. Whether the team would have repeated remains unknowable.
LeBron played with more star names, including Dwyane Wade, Chris Bosh, Kyrie Irving, Kevin Love and Anthony Davis, with less continuity. Some of his rosters were weaker than any title-era Jordan roster; some had more top-end offensive talent. The strongest individual title-season co-star in either sample may have been 2020 Davis. The comparison that survives scrutiny is roster variation for LeBron and institutional coherence for Jordan.
A 2020 FiveThirtyEight study covering LeBron only through the 2018 postseason found:
Evidence19
Historical study · published 2020
Defeated opponents and conference context
FiveThirtyEight data through 2018. The first two rows include only series wins, so they do not measure every opponent faced; the study also omits LeBron’s 2019–26 seasons.
Jordan LeBron
Every row has its own labeled axis; compare the two players within that measure only.
The first two rows include only opponents each player defeated, not every opponent faced, and the comparison is series-weighted. It therefore supports a narrower claim than “tougher playoff path”: Jordan's defeated opponents were stronger on average in this study, and his Eastern Conference field was stronger by average SRS. The study omits LeBron's 2019–26 seasons.
At the top end, LeBron faced the stronger Finals extremes: the Spurs dynasty and four versions of Golden State, including the 73–9 Warriors and two Kevin Durant teams. The 73-win Warriors are the highest-win regular-season opponent either player defeated. That makes 2016 their highest-win series victory, without claiming a complete opponent-adjusted ranking of every series.
Jordan had the stronger average defeated-opponent evidence in the cited window. LeBron faced the strongest opponent at the top of the distribution. Team strength sets the final test: what each player was expected to do, and what he produced once the Finals began.
09
Why 6–0 does not settle it
23
Cleveland · Game 6 · 2016 FinalsThe series that makes a Finals record impossible to read in isolation.LeBron shoots in Game 6 of the 2016 NBA FinalsPhoto: Erik Drost · June 16, 2016 · source · CC BY 2.0 · Editorial crop; otherwise unaltered.
Jordan's 6-0 Finals record is evidence of extraordinary championship conversion. A Finals record still measures a team result.
Historical listed series prices put Chicago as the favorite in all six Finals, with no-vig win probabilities ranging from 53.2% in 1998 to 87.2% in 1996. LeBron's teams were favored in three of ten: 2011, 2013 and 2020. He won two titles as an underdog, lost once as a favorite and entered seven Finals with the market expecting the opponent to win.
Evidence20
Expectation before outcome
What the Finals market expected
Archived series prices converted to no-vig win probabilities using both sides of each market. Odds price the whole team, including the star. They do not isolate supporting-cast quality.
The no-vig probabilities use both listed prices: each side's raw implied probability divided by the two sides' sum. These are archived prices and may differ from a consensus closing line. The market priced the entire team, including the star, roster, coaching and matchup. The odds show expectation before outcome. They do not isolate supporting-cast quality.
The listed probabilities sum to 4.21 expected titles for Jordan against six actual titles, a +1.79 team result relative to the market. LeBron's listed probabilities sum to 4.11 expected titles against four actual titles, a −0.11 result. This is team-level context from one odds archive, separate from individual performance.
Pre-series expectation is one half of the Finals story. The other is what the player actually supplied once the series began.
Evidence21
Production inside the result
What each player supplied in the Finals
Career Finals figures are pooled across all games: 35 for Jordan and 55 for LeBron. Share means player total divided by his own team’s total in those same games, calculated separately for each category. Steals and blocks are sparse events, and older defensive box-score recording adds uncertainty.
Jordan LeBronShared team-production-share axis0%25%50%
PTSPoints
Jordan33.6 / game
34.8%
LeBron28.4 / game
28.8%
REBRebounds
Jordan6.0 / game
15.1%
LeBron10.2 / game
24.4%
ASTAssists
Jordan6.0 / game
25.5%
LeBron7.8 / game
40.6%
STLSteals
Jordan1.8 / game
21.0%
LeBron1.7 / game
22.2%
BLKBlocks
Jordan0.7 / game
13.3%
LeBron0.8 / game
19.8%
Two runs, one impossible finish
What LeBron’s career Finals average contains
20156 games
PTS
35.8
REB
13.3
AST
8.8
STL
1.3
BLK
0.5
Led both teams in PTS, REB and AST
20167 games
PTS
29.7
REB
11.3
AST
8.9
STL
2.6
BLK
2.3
First player to lead a Finals in all five categories
First player to lead a Finals in all five categories
LeBron · 2016 Games 5–7
3
36.3
N/A
11.7
N/A
9.7
N/A
3.0
N/A
3.0
N/A
Three straight wins after trailing 3–1
Jordan owns the Finals scoring comparison: more points per game and a larger share of Chicago's points. LeBron's career Finals rates are higher in rebounds, assists and blocks; his share of team production is higher in rebounds, assists, steals and blocks. Rate asks what the player averaged. Share asks how much of his team's recorded production flowed through him. Neither turns unlike events into one synthetic total.
Steal and block shares require more caution than points, rebounds and assists. Defensive box-score events are sparse, small changes move the percentage materially, and older statkeeping adds uncertainty. I use them as supporting evidence for role breadth, not a defensive verdict.
The individual runs make the breadth concrete. In 2015, with Kevin Love out and Kyrie Irving available for only one Finals game, LeBron became the first player to lead both teams in points, rebounds and assists. He carried extraordinary volume with poor efficiency: 35.8 points, 13.3 rebounds and 8.8 assists per game on 39.8% shooting and 47.7% true shooting, with 21 turnovers in six games. The workload provides context for the volume and misses.
In 2016, against a 73–9 team and after falling behind 3–1, LeBron became the first player to lead a Finals in all five major box-score categories. Over the three must-win games that completed the comeback, he averaged 36.3 points, 11.7 rebounds, 9.7 assists, 3.0 steals and 3.0 blocks. Cleveland won all three. Golden State's Draymond Green was suspended for Game 5. Andrew Bogut injured his knee in Game 5 and missed Games 6 and 7. Cleveland's Kevin Love missed Game 3 and returned from the bench in Game 4. Green played Games 6 and 7. The comeback remains extraordinary with that availability record stated in full.
Across the 30 games in Finals series LeBron lost, he still averaged 28.5 points, 9.5 rebounds and 7.7 assists. The result still matters, and 2011 still deserves criticism. Finals losses can coexist with championship-level individual production because roster health, opponent quality and teammate output affect how that production converts.
Losing in the Finals is not worse than losing one round earlier. A 4–6 record across ten appearances should not be compared with an imaginary 4–0 created by deleting six deeper playoff runs. Jordan deserves full credit for converting every Finals appearance, including the near-coin-flip 1998 matchup. LeBron deserves credit for reaching ten, including seven as an underdog.
The comparison also crosses different competitive structures. From 2019 through 2026, eight franchises won eight consecutive championships, an NBA record. Greater roster movement, league size, payroll restrictions and three-point variance may all contribute. The streak does not establish that modern titles are worth more. It shows why raw ring counts need individual production, team quality, expectation and opponent strength beside them.
10
Test the strongest LeBron critiques
LeBron's 2011 Finals remains the clearest single-series failure on either resume. Dallas changed the geometry of the series, LeBron became passive at crucial moments and Miami lost as the favorite. The criticism is earned. The rest of the pressure record is why I do not treat one series as a permanent diagnosis.
His response included 45 points, 15 rebounds and five assists in an elimination game at Boston the next year. Game 7 supplies a cleaner, separate test because the series is tied 3–3 and both teams face the same binary condition. LeBron is 6–2 in eight Game 7s, averaging 34.9 points, 9.9 rebounds and 5.6 assists on 59.9% true shooting. His 279 career Game 7 points are the NBA record. Jordan was also excellent in a much smaller sample: 2–1 in three Game 7s, with 33.7 points, 7.7 rebounds and 7.0 assists per game on 52.9% true shooting.
Evidence22
Series on the line
Game 7 and elimination-stakes production
Game 7 is the clean 3–3 decider. The broader samples cover games in which each player’s team faced elimination. A loss would end its postseason. Every Game 7 qualifies. LeBron is current through the 2026 playoffs; Jordan covers his complete 1985–98 playoff career. Some qualifying games began with the series tied.
Game 7 only
Both teams enter tied 3–3.
LeBron · Game 76–28 games · team record
PTS
34.9
REB
9.9
AST
5.6
Jordan · Game 72–13 games · team record
PTS
33.7
REB
7.7
AST
7.0
All elimination-stakes games
A loss ends the player’s postseason; Game 7 is included.
LeBron · elimination stakes15–1530 games · team record
PTS
32.8
REB
10.4
AST
7.3
Jordan · elimination stakes6–713 games · team record
The eight-game record, scoring total and all-around production give LeBron a credible best-ever Game 7 case. The broader StatMuse “elimination game” samples cover games in which each player's team faced elimination. A loss would end its postseason. The sample includes every Game 7, even though a Game 7 begins tied 3–3.
On that same broader definition, LeBron leads the printed averages in points, rebounds, assists and true shooting. Jordan was still excellent, and 10 of his 13 games came before his first championship; the 6–7 record partly describes an ascending team that encountered elimination far more often than the dynasty did. The samples are small, unequal and not opponent-adjusted. They describe outcomes under pressure. They cannot isolate pressure itself as the cause.
Pressure performance also includes what happens when a playoff roster breaks around the star.
Advancing through attrition
2015 vs. Chicago: Cleveland won 4–2 with Kevin Love out for the entire series; Kyrie Irving was limited late and played only 12 minutes in the closeout.
2015 vs. Atlanta: Cleveland swept the 60-win East top seed without Love; Irving missed Games 2 and 3 with knee tendinitis before returning for Game 4.
Injuries still changed the ceiling of those teams. Cleveland lost the 2015 Finals after Irving joined Love on the sideline, and Oklahoma City swept the 2026 Lakers. LeBron still preserved enough scoring, creation and lineup organization to win several rounds after central teammates disappeared.
Late possessions supply another pressure test. LeBron has eight go-ahead or game-tying playoff field goals in the final five seconds in the modern play-by-play record, including five buzzer-beating winners. A frozen Shot Finder query supplies a selected six-player, high-volume comparison for a slightly wider situation: fourth quarter or overtime, final 50 seconds, shot to tie or take the lead, 1997–2026. Every displayed player has at least 25 attempts. I do not claim the six rows are an exhaustive cohort.
Evidence23
Modern play-by-play era
Late playoff shooting
Frozen query, not independently rechecked in the October 2026 audit: fourth quarter or overtime, final 0:50, shot to tie or take the lead, 1997–2026. Every printed row has at least 25 attempts. Percentages reproduce from the ledger; the underlying query and shot-level selection remain unverified. Coverage includes only Jordan’s final two Bulls seasons. This is not a complete clutch ranking.
Late playoff field goals and attempts in the public play-by-play era
Player
FGM
FGA
3PM
FG%
eFG%
LeBron James
23
49
5
46.9%
52.0%
Kobe Bryant
11
40
2
27.5%
30.0%
Kevin Durant
9
31
3
29.0%
33.9%
Paul Pierce
7
26
2
26.9%
30.8%
Damian Lillard
9
25
5
36.0%
46.0%
Russell Westbrook
3
25
1
12.0%
14.0%
Swipe to see every column →
Track length is attempts; the solid segment is makes. The public dataset begins in 1996–97, covers only Jordan’s final two Bulls seasons, and is not a full-career Jordan comparison.
This is a frozen, selected modern play-by-play sample. The ledger reproduces the displayed percentages, but the underlying hosted query and shot-level selection could not be independently rechecked in the October 2026 audit. It covers only Jordan's final two Bulls seasons and excludes free throws and passing. The printed rows show LeBron with the highest volume and efficiency; they cannot establish a complete clutch ranking.
The standard for teammate shots should also be consistent. John Paxson made the title-winning three in 1993. The ball moved from Jordan to Pippen to Horace Grant to Paxson, so Jordan did not receive the assist. Steve Kerr's 1997 winner came directly from Jordan's pass after the defense doubled. Ray Allen's 2013 three and Kyrie Irving's 2016 shot deserve full credit as historic teammate plays. LeBron still produced a 16-point fourth quarter in Game 6 against San Antonio, 37 points in Game 7, and 27 points, 11 rebounds, 11 assists and the chasedown block in Game 7 against Golden State. Great teams require great teammate plays.
The pass-first critique fails for a simpler reason. LeBron became the regular-season and playoff scoring leader while remaining one of the greatest creators ever. His instinct to pass makes him a different offensive engine: the defense can lose to his own shot, a skip pass, a pocket pass or a mismatch he created before the final action.
Defense needs the same peak-versus-career distinction. Jordan has the stronger defensive awards resume: one Defensive Player of the Year, nine All-Defensive First Teams and a higher steals rate. LeBron still made six All-Defensive teams, including five First Teams. He also finished in the top four of DPOY voting four times: second in 2009, fourth in 2010, fourth in 2012 and second in 2013. That voting record supports the claim that his defensive peak belonged among the league's elite even though he never won the award. At his Miami peak he could credibly switch across multiple positional types, protect from the weak side and erase transition opportunities. Defensive peak and late-career possession-by-possession effort are different questions.
The officiating critique has a direct volume check. LeBron has flopped and exaggerated contact. He averaged 7.43 regular-season free-throw attempts per game to Jordan's 8.18. Their free-throw rates, calculated as attempts divided by field-goal attempts, were .383 and .358, respectively. These two-player comparisons do not show that LeBron was under-officiated or that Jordan relied on whistles. They show that LeBron did not reach his scoring total through more free-throw volume than Jordan.
With the individual critiques separated, the last team-level question is how far each player raised the baseline and the ceiling.
11
Floor raising and ceiling raising
“Floor raising” means improving weak or incomplete teams; “ceiling raising” means adding value when strong teams approach championship level. Neither is directly observed in a box score, and both are affected by teammates, coaching and replacement minutes.
LeBron has the broader observed floor-raising range across franchises. His with/without and transition records support that interpretation as descriptive evidence. They do not establish causation.
Jordan's reconstructed evidence rejects the idea that he was only a finishing piece on loaded teams. Across the available sample, his teams were +8.4 points per 100 possessions with him in regular-season minutes and −3.1 without him. The playoff reconstruction puts Chicago at +7.7 and −10.4. The off-court samples are much smaller, and the estimates draw from the same reconstructed possession record as other historical tools rather than supplying an independent replication.
Jordan's team transitions also point in the same descriptive direction. Chicago improved by 11 wins in his rookie year; went 13–4 after his late 1995 return following a 34–31 start; and Washington improved from 19 wins to 37 in each of his two seasons at ages 38 and 39. Roster and health changes prevent causal attribution.
LeBron has the broader demonstrated adaptability case. Jordan has the stronger plug-and-play scoring case and the championship-conversion advantage. Both raised floors and ceilings. The scorecard keeps those conclusions separate before I make the final choice.
12
The honest scorecard
Evidence25
Synthesis
The honest scorecard
Several rows draw from the same underlying evidence. Rate, per-game, total and contextual judgments remain separate. No row earns a point, and neither conclusion is mathematically inevitable.
JordanNeither clearlyLeBron
Career value
Better total career
J·LLeBron
More cumulative measurable value
J·LLeBron
Better regular-season composite-rate performance
J·LJordan
Peak
Better completed-title-run peak
J·LJordan
Better season peak
J·LUnresolved; credible LeBron case
Best statistical apex in a completed title run
J·LJordan
Offense
Better scorer
J·LJordan
Higher scoring average in both regular season and playoffs
J·LJordan
Better passer and offensive organizer
J·LLeBron
Lower box-score turnover rate
J·LJordan
Better assist-to-turnover ratio
J·LLeBron
Peak / career
Broader statistical production: peak vs. cumulative
J·LPeak: unresolved · cumulative: LeBron
Playoffs
Better playoff composite-rate performance
J·LJordan
More total playoff value
J·LLeBron
Higher Finals scoring average and team scoring share
J·LJordan
Broader all-around Finals production
J·LLeBron
Stronger elimination-stakes box-score production
J·LLeBron
Defense
Better defensive peak
J·LUnresolved; reasonable Jordan lean
Broader demonstrated defensive-role versatility
J·LLeBron lean · qualitative
Context
Stronger defeated-opponent average in cited study
J·LJordan
Tougher top-end Finals opponents
J·LLeBron
Better team Finals results relative to listed pre-series odds
J·LJordan
Verdict
Cleaner projected fit beside another primary creator
J·LUnresolved; reasonable Jordan edge
Better floor raiser
J·LDifferent evidence; no clean causal winner
Best all-around basketball player
J·LLeBron
Greatest demonstrated adaptability across eras
J·LLeBron
Best choice for a single championship run
J·LJordan, narrowly
One season on an unknown roster
J·LLeBron
Entire career
J·LLeBron
View underlying data table
The honest scorecard
Question
My conclusion
Evidence lens
Better total career
LeBron
Career value
More cumulative measurable value
LeBron
Career value
Better regular-season composite-rate performance
Jordan
Career value
Better completed-title-run peak
Jordan
Peak
Better season peak
Unresolved; credible LeBron case
Peak
Best statistical apex in a completed title run
Jordan
Peak
Better scorer
Jordan
Offense
Higher scoring average in both regular season and playoffs
Jordan
Offense
Better passer and offensive organizer
LeBron
Offense
Lower box-score turnover rate
Jordan
Offense
Better assist-to-turnover ratio
LeBron
Offense
Broader statistical production: peak vs. cumulative
Peak: unresolved · cumulative: LeBron
Peak / career
Better playoff composite-rate performance
Jordan
Playoffs
More total playoff value
LeBron
Playoffs
Higher Finals scoring average and team scoring share
Jordan
Playoffs
Broader all-around Finals production
LeBron
Playoffs
Stronger elimination-stakes box-score production
LeBron
Playoffs
Better defensive peak
Unresolved; reasonable Jordan lean
Defense
Broader demonstrated defensive-role versatility
LeBron lean · qualitative
Defense
Stronger defeated-opponent average in cited study
Jordan
Context
Tougher top-end Finals opponents
LeBron
Context
Better team Finals results relative to listed pre-series odds
Jordan
Context
Cleaner projected fit beside another primary creator
Unresolved; reasonable Jordan edge
Verdict
Better floor raiser
Different evidence; no clean causal winner
Verdict
Best all-around basketball player
LeBron
Verdict
Greatest demonstrated adaptability across eras
LeBron
Verdict
Best choice for a single championship run
Jordan, narrowly
Verdict
One season on an unknown roster
LeBron
Verdict
Entire career
LeBron
Verdict
13
Where I land
LeBron's case rests on scoring, creation, rebounding, tactical flexibility, portability and an unprecedented duration of elite value. Jordan's rests on scoring, completed-title-run peak dominance, low box-score turnover rates, defensive disruption and perfect Finals conversion. The evidence narrows the disagreement. The final step is deciding which form of greatness matters more.
If I need one shot, one game, one series or one fully healthy championship run, I lean Jordan. The margin is narrow enough that choosing LeBron in any of those settings remains reasonable. Over an entire career, it is not a toss-up for me. I take LeBron clearly because he sustained elite value for much longer and solved more roster-construction problems across teams, roles and eras.
LeBron's longevity matters because the value stayed elite and broad. He averaged at least 20 points in every season, reached 302 playoff games and continued to carry scoring, rebounding and creation responsibility as the league changed around him. No player I evaluated combined this much production with this much tactical range for this long.
Jordan reached the sharper championship apex and remains the greatest scorer I have watched. LeBron built the greater career and became the more complete basketball answer. That is why LeBron is my 1A and my GOAT. Jordan is my 1B.
Where I land
The greatest all-around player. The greatest scorer.
1A · Best career · Best all-aroundLeBron James
1A / 1B
1B · Best title-run peak · Best scorerMichael Jordan
LeBron could solve more kinds of basketball problems across more rosters, systems and versions of the sport. The league kept changing; he kept finding a new way to command it. That all-around mastery is why LeBron is my GOAT. Longevity matters because the value stayed elite and broad. Jordan reached the sharper championship apex and remains my choice as the greatest scorer.
The central career tables use Basketball Reference's canonical career rows through 2025–26; Jordan's playoff minutes therefore follow its published 7,474-minute convention. Rate and total measures are kept separate. VORP/BPM and Win Shares are treated as overlapping box-score model families rather than independent votes. Team transitions, with/without records and betting odds are contextual evidence. They are not causal estimates of individual value.
The sustained-scoring module uses all 186 player-seasons for the current top ten NBA career scorers. A career season is a regular season in which the player appeared; retirement and injury seasons with zero games are omitted, and multi-team rows are counted once using the full-season total. There is no minimum-games qualification, so short injury or comeback seasons count. Each rate and the 20- and 25-point thresholds are calculated from exact season points divided by games, with displayed rates rounded half up to one decimal. Field-goal attempts are summed from those same season rows, and the core comparison divides the career total by career games. The line chart's horizontal axis is career season number, which compares duration without pretending the players entered the league in the same era. Every series has a persistent color. Hover, keyboard focus or selection only adds emphasis and updates the detailed readout.
The companion scatter uses the same fixed ten-player cohort across three scopes. Regular-season points and minutes follow Basketball Reference's canonical career totals. Summing separately rounded season-minute rows can differ from the career total: Harden's season rows sum to 42,449, while the career leaderboard reports 42,450. Playoff points and minutes come from the complete NBA/ABA career leaderboards. The combined view adds the two scopes. It defaults to playoffs and plots minutes on the horizontal axis and points on the vertical axis. Its diagonal guides represent constant scoring rates of 18, 24 and 30 points per 36 minutes. The cohort is selected on final regular-season points, so the playoff view is a consistent comparison set rather than a playoff-leader selection.
The reciprocal leaderboards use NBA-only regular-season totals through 2025–26, excluding standalone ABA statistics. Exact cross-ranks through 250 were checked against Basketball Reference's NBA tables. A printed 250+ means outside the top 250, not an exact rank: the player's total falls below that table's 250th-place cutoff. The cutoffs are 12,748 points, 5,347 rebounds and 2,981 assists. Those cells replace deeper ranks that could not be independently rechecked. The five-stat cohort is selected and ordered by Basketball Reference's published regular-season career VORP leaderboard, which uses NBA/ABA scope. The five displayed career totals are NBA-only. VORP selects and orders the cohort; it is not calculated by adding the five displayed totals, although it uses overlapping box-score inputs. VORP, steals and blocks begin in 1973–74, so the historical coverage limitation is shown beside the table and unavailable statistics are not treated as zero.
The playoff-run chart sums each Basketball Reference series row into one postseason. Its horizontal axis is cumulative games, so a 23-game Finals run occupies more space than a first-round exit. True shooting is recalculated from postseason totals as points ÷ [2 × (field-goal attempts + 0.44 × free-throw attempts)]; the public ledger includes both attempt inputs. The same ledger sums field-goal attempts for the core playoff comparison. Each career-total leaderboard prints the top five and adds a featured exception row when LeBron or Jordan sits outside that range. The ranks use Basketball Reference's NBA/ABA career leader pages. LeBron and Jordan's games, points, rebounds, assists, steals and blocks are also checked against the summed postseason rows; minutes use Basketball Reference's published career total. Rebounds begin in 1950–51, minutes begin in 1951–52, and steals and blocks begin in 1973–74. The playoff-leadership counts use each player's full-postseason team totals, run by run, with ties counted. They are availability-weighted because missing games reduces the chance to lead a team total.
LeBron's playoff on-off row reports player-minute-weighted means of annual unadjusted team net ratings with him on the court, with him off the court and the annual on-off swing. It does not pool career on-court and off-court possessions into one estimate. The public ledger preserves all 19 annual inputs. The October audit reproduced the calculation and freshly confirmed 18 source rows; the 2016–17 source row could not be retrieved again. The columns are rounded independently, so displayed subtraction can differ from the displayed swing by 0.1. Jordan's row uses Basketball History Database's published reconstructed playoff career summary, checked on October 6, 2026, covering all 179 games. Its separate regular-season reconstruction now covers 819 of 1,072 games, or 76.4%, including Chicago and Washington. I have omitted the regular-season normalized comparison until a complete current LeBron input export is available. The different aggregation methods and estimated historical possessions prevent a like-for-like ranking. I did not publish the reposted −2,123 raw LeBron off-court total because I could not trace it to a stable query or row-level source. On-off does not control for teammate, opponent or bench composition. Postseason off-court samples are especially small.
The teammate comparison covers the seven requested stars and every regular season they played. A teammate is counted only when both players shared a team during that season and the teammate's annual Basketball Reference row carries an All-Star or All-NBA selection. Multi-team rows are deduplicated by player-season. These counts are not adjusted for changing award roster sizes or selection formats. A shared season counts regardless of how many games two midseason teammates overlapped. The method does not measure depth, injuries, fit, coaching or playoff performance. Season share means seasons with at least one honored teammate divided by the subject's career seasons. The playoff-help exhibit changes the denominator to games won and lets the reader choose All-NBA or All-Star. A win counts only when no teammate selected to the chosen honor that season appeared in the game. The 32-row dual-honor ledger rebuilds LeBron and Jordan season by season; the reported league-wide ranks come from HoopsHype's May 2026 reviews and are labeled as external.
The broader elimination-stakes samples cover games in which each player's team faced elimination; Game 7 is the subset in which both teams entered under the same win-or-go-home condition. Jordan's 13 qualifying games and the raw inputs behind his 53.7% true shooting are frozen in a public row-level calculation ledger. The late-shot table freezes a selected aggregate view from the stated public query. Its FG% and eFG% can be recomputed from the published FGM, FGA and 3PM, but the packet does not include the row-level shot export needed to reproduce the cohort selection without the hosted query. Historical reconstruction results are labeled partial and are not compared directly with modern full-coverage RAPM as if the data environments were identical.
Finals career figures are pooled across every Finals game instead of averaging series averages: 35 games for Jordan and 55 for LeBron. A category's production share is player category total ÷ his team's category total across those same games. Points, rebounds, assists, steals and blocks remain five separate denominators; they are never added into an “all-around” score. Steals and blocks are sparse events, and older defensive box-score recording adds uncertainty. The 2015 row distinguishes LeBron's both-team leadership in points, rebounds and assists from his 2016 distinction as the first player to lead a Finals in all five categories. The 2016 Games 5–7 line uses the three official game boxes; LeBron's lost-series line pools the six Finals he lost, 855 points, 284 rebounds and 231 assists across 30 games.